
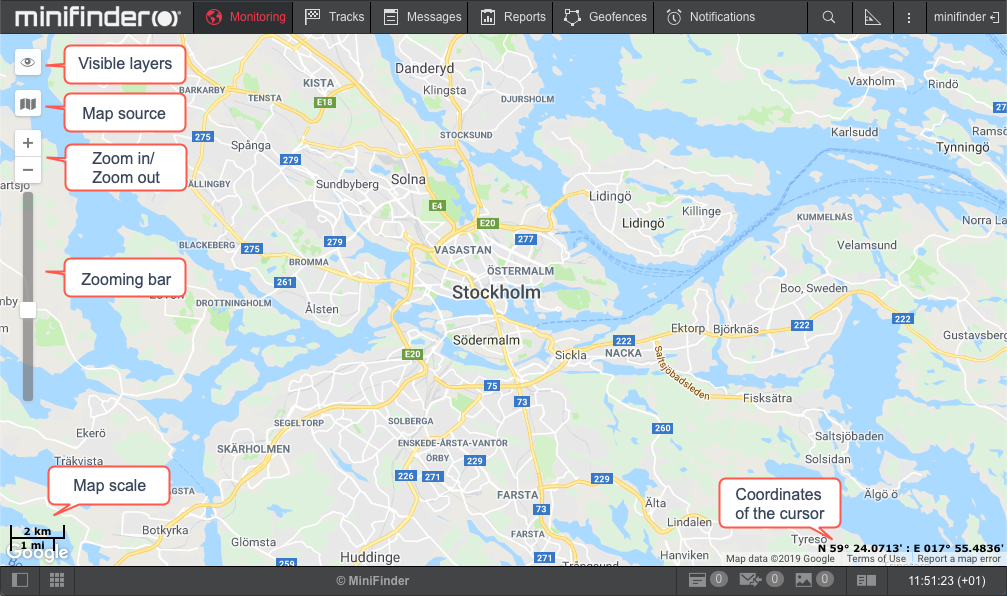
The map is available regardless of which panel is activated. Usually, it takes up most of the screen. Units and their traces, geofences and other elements can be displayed on the map.
Map size can be adjusted in relation to the work area and the log. To do this, drag up/down or left/right the map scale slider, which is located between the corresponding parts of the interface.
To maximize the map size as much as possible, you can hide the work area and the log completely (using the ![]() and
and ![]() buttons) and switch to the full-screen mode by pressing F11.
buttons) and switch to the full-screen mode by pressing F11.
Map Source
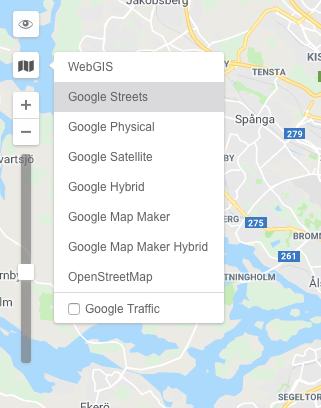
To change the map source, click the ![]() button in the top left corner of the map. Map selection menu is conditionally divided into two sections. The upper section contains base map layers, i.e. map sources. The bottom one contains additional or, in other words, informational layers which overlay the base ones (traffic, maritime navigation, etc.). Select another map from the list and the map area already displayed on your screen will be loaded from another source. It is applicable to both the main map and the mini-map.
button in the top left corner of the map. Map selection menu is conditionally divided into two sections. The upper section contains base map layers, i.e. map sources. The bottom one contains additional or, in other words, informational layers which overlay the base ones (traffic, maritime navigation, etc.). Select another map from the list and the map area already displayed on your screen will be loaded from another source. It is applicable to both the main map and the mini-map.
To activate more maps, go to the User Settings. There you can also save the current position of the map for the further system logins. If the option for switching on any kind of maps is not available, contact your tracking system administrator.
If additional map layers are available, then they can be displayed on top of the base ones. In other words, all the maps can display the information on road traffic condition or maritime navigation. To enable it, you should select the corresponding checkbox in the section of additional layers in the map selection menu (Google Traffic, Yandex Traffic, etc.).
![]() Attention!
Attention!
The map selected in this menu affects only the displayed (graphical) map layer. Geocoding (address definition, etc.) is implemented mainly in Google Maps.
Visible Layers
The map provides the possibility to display with graphic layers. In other words, different graphic layers can be enabled/disabled on the map. The layers display graphic elements of such panels as monitoring, tracks, messages, reports, geofences, routes, drivers, trailers, and passengers.
Displaying layers on the map is possible only if there are corresponding panels in the main menu. For example, if the main menu contains a monitoring item, then on the map you can enable the same layer showing the current location of the indicated units. When you add an item to the main menu, its layer is automatically activated. When you remove an item, the layer is removed.

Enabling/disabling a graphic layer is implemented in the layers menu. To access this menu, click the Eye icon (top left corner of the map). The layers menu is divided into 2 sections: layers of panels (on the left) and layers of units (on the right). Each graphic layer is represented by the icon of its panel. Working with the layers of panels is described above. Layers of units serve to control the view on the map (unit traces, their names, the assigned drivers’ names, the direction arrows).
The Order of Displaying Layers
The layers are displayed in a specific order. Depending on the rendering priority, they can be divided into 7 groups, which are listed below. The elements of each next group are rendered upon the previous one. Some groups also have an internal rendering hierarchy.
I. Base map layers
II. Additional map layers
III. Base vector layers
- Geofences rendered in the browser
- Elements rendered on the server
- Trips in the trips report
- Routes
IV. Additional vector layers
- Inscriptions for drivers and trailers
- Tails of units
- Direction arrows of the movement of units
- Names of units
- Status icons
- Inscriptions of the markers of the LBS Detector instrument
V. Markers
- Icons of the geofences rendered in the browser
- Markers of the drivers and trailers unassigned from units
- Unit markers
- Markers of the drivers and units assigned to the units
- Markers of the Messages panel
- Markers of the initial/final position of the tracks in the tracks and reports panels
- Markers of the tracks hittest when geofences, reports, tracks are rendered on the server
- Names of geofences
VI. Instruments
- Track Player
- Distance
- Area
- Address
- Routing
- Hittest
- Nearest Units
- LBS Detector
VII. Editing Layers
-
Created geofence
Using the Map While Working with Different Panels
The map is common for all panels. It means that while switching between the panels, zoom and coordinates of the map center remain the same. Graphic elements such as track lines, markers, geofences, icons of units remain in their places. Therefore, for example, if you made a report showing parking locations on the map and then switched to the tracks panel to create tracks for the unit’s movement (even if this is a completely different unit), all the graphical elements, lines, markers, etc. still will be shown on the map until you delete them or switch them off.
Such panels as Monitoring, Tracks, Messages, Reports, Geofences, Routes, Drivers and Trailers can have their layers on the map. Graphic elements applied to a map when working in a particular panel, can be easily switched on and off. Displaying or hiding the graphic information on the map is adjusted for each layer individually in the layers menu, which can be opened by clicking on the Eye icon in the upper left corner of the map. Here you can read more about the work area.
Map Navigation
To navigate through the map (or, more accurately, move the map across the screen), left-click anywhere and, without releasing the button, drag in the desired direction.
Zooming the Map
To scale the map, you can also use several methods:![]()
- Using scale on the map
In the upper left corner of the map, under the navigation buttons, there is a scale bar that allows you to zoom in (+) or zoom out (-). In this case, the center of the map does not change its position. You can press + and – buttons to change the scale in a step-by-step mode, or click anywhere on the gradation scale. - Using mouse scroll wheel
It is even more convenient to adjust zoom level using the mouse scroll wheel. Scroll up to zoom in and scroll down to zoom out. Direct the cursor to the required place so that it is not lost from view when the scale is changed. - Using mouse and Shift button
To zoom in on the area you selected, hold the Shift button and left-click any rectangle on the map - Using double-click
Double-click any point of the map to zoom in on it.
In the lower left corner of the map the current scale of the map is indicated. In the lower right corner, you can see the geographical coordinates of the place the cursor points at. The coordinate format is selected in User Settings => Maps and can be either degrees or degrees and minutes.