
After executing a report, under the Report Templates panel appears another one — Report Results; in the lower right part of the window, tables or charts are displayed. If no information has appeared, it means that there is no required data about the unit for the specified time interval.
The Report Result panel displays a list of its contents: tables, charts, statistics. Click on the name of the required component to open it in the lower part of the window. The name of the opened table/chart/statistics has a darker background, as well as a blue dot if two report windows are displayed simultaneously.
Information in the report can be presented in the form of tables or charts. Some information can be visualized on the map, for example, tracks and markers.
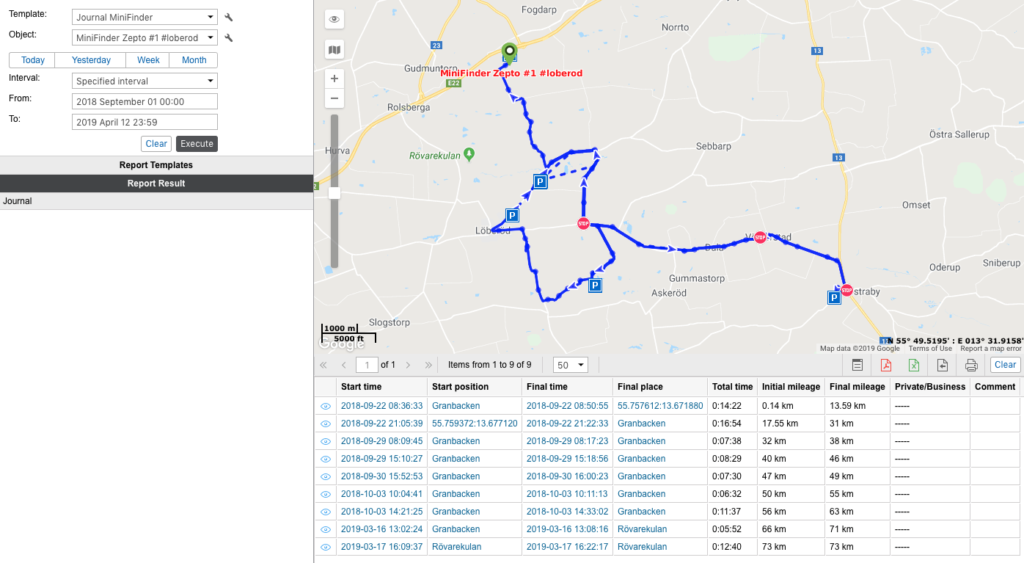
If there are columns with blue text in the table, it means that there are coordinates for this point. Click on the cell to move to the location on the map.
A table report can contain up to 100 000 lines, therefore it is divided into pages. To navigate between pages, use the navigation buttons at the top of the window (blue arrows):
![]() show the next page;
show the next page;
![]() show the previous page;
show the previous page;
![]() go to the first page;
go to the first page;
![]() go to the last page.
go to the last page.
The page number can be entered manually. After typing in a number, press Enter to go to the required page.
You can also adjust the number of rows per page by selecting one of the available options (25, 50, 100, 200, 500) in the drop-down list in the toolbar for working with tables (located above the table).
The toolbar also contains the following buttons:
![]() — the button to go to the messages;
— the button to go to the messages;
![]() — the button for quick export to PDF (landscape orientation, A4 format and fixed page width is a default setting for a PDF file);
— the button for quick export to PDF (landscape orientation, A4 format and fixed page width is a default setting for a PDF file);
![]() — the button for quick export to Excel;
— the button for quick export to Excel;
![]() — the button to export the report to a file;
— the button to export the report to a file;
![]() — the button for printing the report.
— the button for printing the report.
To remove a report and the Report Result section from the screen, press Clear.
![]() /
/![]() — the switch buttons between the Map-report view and Dual report view modes.
— the switch buttons between the Map-report view and Dual report view modes.
Transfer from tabular report to messages
it is possible to go to the messages straight from an online report table. This can be useful for analyzing the data messages from a unit.
To move from the table to messages, press the Transfer to messages button ![]() . After pressing it, the text in some cells which indicate time (such as Time, Beginning, End, etc.) becomes purple. These links work as links. Click on the link to go to messages.
. After pressing it, the text in some cells which indicate time (such as Time, Beginning, End, etc.) becomes purple. These links work as links. Click on the link to go to messages.
Messages are loaded for the entire reporting period, and the page with the selected message opens immediately. The line with this message is highlighted in grey. The map is centered on the selected message, which is indicated with a red marker.
By default, the transfer button is inactive. If the button was active in one of the tables, this state is preserved when switching between tables. However, when you switch from the table to the chart, the button returns to the default state, i.e. it is inactive.
Dual report view
If the report contains several charts or tables, it is possible to activate the dual report view. To do this, press the Dual report view button. The chart or table will replace the map. By default, a chart or table which follows the current one in the Report result list opens.

To switch between the pages of the report, activate the top or bottom window by clicking on it (its frame turns blue) and select the required page in the report result panel. Active page is marked with the icon ![]() .
.